It’s a new year and many chiropractors are evaluating what will enhance their respective practices, particularly as it relates to their bottom line. One of the most common questions I get is: “Do I need to be credentialed to bill insurance, and what are the best plans to join?” It’s a loaded question – but one every DC ponders. Whether you're already in-network or pondering whether to join, here's what you need to know.
Outcomes Assessment: How to Satisfy the Insurance Industry with Time-Efficient Documentation
At one time or another, we have all found that the reimbursement of a patient's care was being denied. "Please provide documentation to demonstrate the necessity of your treatment" requests are now the norm for the practicing chiropractor. Every provider of every discipline is being held accountable for the care provided to a patient. Why? Because evidence-based treatment approaches are becoming an expected "standard" of proving the effectiveness of care over time, and because tracking outcomes is a means by which insurers decide if the care provided has been necessary. No longer can we treat patients without providing meticulous documentation that can take several times longer to generate than the actual treatment of the patient. One of this article's goals is to provide you with a method of incorporating a streamlined approach to documentation you can implement into your practice.
Another reason documentation to support the services being provided is commonly requested is that not every provider complies with the insurer's request, thereby accepting the care and reimbursement restrictions. I once asked an insurance case manager why the company they represented continually denied care even when the documentation provided clearly supported "medical necessity." After a pause, the case manager replied, "... because only about 20% of you ever dispute our decision."
This brings up the point that unless we collectively agree to dispute our rejected claims, this process will never stop. The second goal of this article is to provide you with a method of producing "bullet proof" documentation so that when you dispute an insurer's decision to deny payment on a claim, you can provide them with a quick summary of the case, referencing specific outcomes data that will make it very difficult for an insurer to deny payment.
The general concept is changing from a system of documentation in which qualitative information is gathered to one that is quantitative. That way, outcomes-oriented information is gathered and changes over time can be appreciated. For example, "I have low back pain and sitting hurts" is (qualitative) to "BP rated at 7/10 right now, 5/10 on average, in a range between 3 and 9/10, with sitting intolerance >5 minutes." The former may read the same four weeks later in spite of some improvement and not "tell a story."
The latter, on the other hand, allows the reviewer of the notes to see whether an improvement over time has occurred, which would support the opinion that the treatment intervention is helping, thus justifying the necessity for further care. If no change or worsening occurs, this should prompt a change in the treatment approach.
There are essentially three critical steps that need to be followed when establishing an outcomes-based practice and to "bullet proofing" your documentation and case management process. These are as follows (Yeomans, 2000):
- Know which outcome tools to implement and score the tools;
- Repeat the use of the tools on re-exam and compare the scores;
- Most important: Make clinical decisions based on the results.
The first step requires acquiring the knowledge base of which tools to choose when a patient first presents. Several "domains" need to be individually tracked to ensure proper decision-making when clinically managing patients. These essentially represent the reasons why patients decide to obtain health care provision in the first place, which include pain, disability, and quality-of-life deterioration.
The first domain is the tracking of the patient's pain. This can be easily accomplished in two ways. The first is to quantify the degree of pain (0-10 scale) as it is reported: "right now," "on average" ("typical" pain level), and "worst" (von Korff, 1992). A fourth question that this author feels is important to ask is, "What is your pain level when you're at your best?" or "How close to zero are you when you're feeling your best?" (closest to "0"). By asking these questions, you can quantify the improvement of pain experienced by the patient as you administer treatment.
Since pain is one of the most common reasons patients present to our office for chiropractic care, tracking pain reduction is considered very important (Frank, 1996; Cherkin, 1996; Von Korff, 1993; Linton, 1998; Hazard, 1996; Bolton, 1998; and others). This not only helps you determine the effectiveness of the care the patient is receiving; it also serves as a great means of communicating to others that the care being administered is helping. Of course, if the pain scale levels do not improve, this will prompt you to change the treatment approach you are currently utilizing. Therefore, you benefit from providing optimum care on a timely basis.
The second tool belonging to the pain domain is the pain drawing. This is important because it allows the patient to draw their pain location and quality of pain onto a picture. Though pain drawings can be scored (Ohlund, et al., 1996), the qualitative information of this instrument is adequate, in my opinion, if the quadruple VAS is being used. Since "a picture is worth a thousand words," it is easy to appreciate a change in the pain quality and location with the pain drawing, as pain often localizes or centralizes as the patient improves under your care. The manner in which a patient interprets their pain on a drawing has also been used to evaluate the psychological status of the patient (Parker, et al., 1995).
The second domain that is important to gather and track outcomes data is by quantifying the patient's disability. In this category, the patient's activities of daily living (ADLs) are tracked quantitatively by assigning a score to each of 10 ADLs in the Oswestry Low Back Disability Questionnaire. This tool includes 10 questions regarding activities such as personal care (washing and dressing), lifting, walking, sitting, standing, sleeping, social life and driving. Therefore, this questionnaire represents an activity intolerance list and serves as a list of patient goals which can be quantitatively tracked and compared over time.
Like pain, the patient's disability or inability to function on the job and/or at home is another feature that drives patients into our offices. Tracking improvement in this domain yields valuable information for all concerned (patients, providers and insurers).
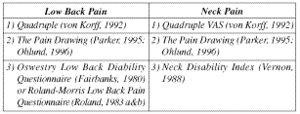
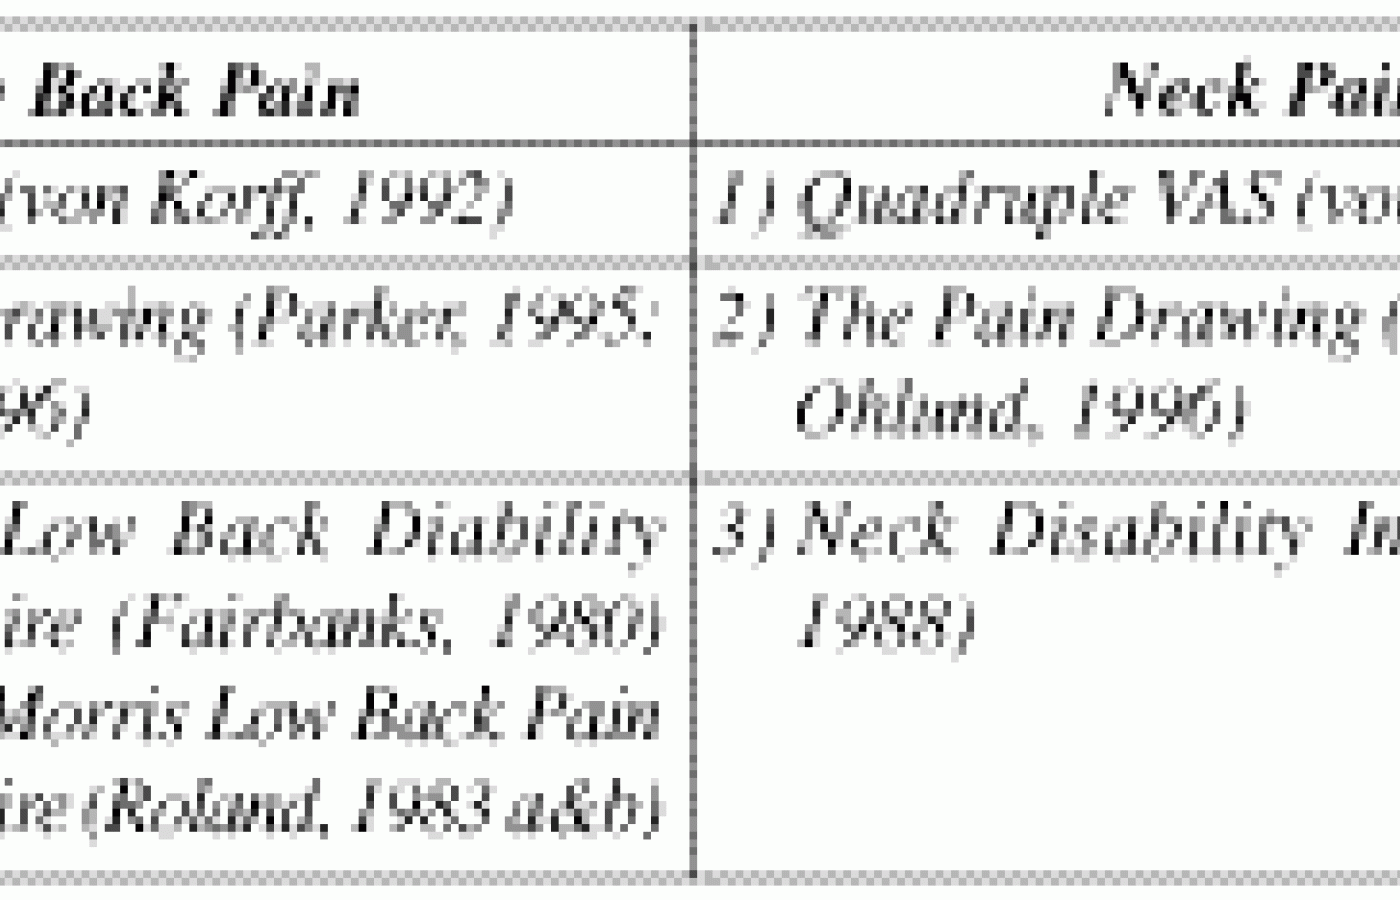
If these domains (using the quadruple VAS, the pain drawing, and a low back disability questionnaire) were the only items tracked on a patient presenting with low back pain, you would find that strong clinical decision-making can be achieved through the use of these tools. Examples of the outcome tools that can be utilized in patients presenting with low back pain and/or neck pain are listed in Table I. Alhough there are condition-specific questionnaires available that track shoulder, elbow, wrist, hip, knee and ankle conditions, not to mention headaches, dizziness, depression, anxiety, risk of poor recovery and others, the topic described here will be limited to spinal disorders.

Table I: Examples of questionnaires that can be used to track outcomes for low back and neck pain.
The third domain to consider tracking is general health. This domain is important because it tracks the patient's quality of life in relation to their presenting complaint. This tool is not condition-specific and therefore is applicable to all patients regardless of their complaint. This tool is also unique in that it combines eight small questionnaires into one tool, and normative data has been gathered on both healthy subjects and those with various conditions (Ware, 1994).
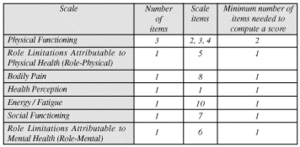
To streamline the time needed for the patient, the questionnaire has recently been reduced from its previous 36 question version to 12 (Ware, 1995). The short form 12 includes questions that belong to the eight domains listed in Table II, along with the scale item number and the minimum number of items needed to compute a score.

Table II: There are eight scales that comprise the SF-12.
When only one question drives an entire domain the reliability drops, but the practicality enhancement is obvious (Yeomans, 2000). Normative data is available for the SF-36 and is currently being gathered for the SF-12 (Ware, 1995).
What Else Should Be Considered?
Though no other tools may be needed to track outcomes other than those mentioned previously, other sources of information can help considerably when applying diagnostic triage to a patient. These include tracking "red and yellow flags." Red flags include those conditions that should prompt an immediate referral. With respect to low back pain, four red flags have been identified (Bigos, 1994): cauda equina, tumor, infection and fracture. Specific questions asked during the history can help identify patients with red flags often better then routine physical examination findings (Deyo, 1988, 1991, 1992). Two questionnaire forms have been devised to gather this important information: one that the patient completes and one that is administered to the patient (Yeomans, 2000).Wouldn't it be nice to be able to identify patients who are not likely to improve compared to those that are? Haven't you wondered why some patients presenting with similar history and examination findings often respond very differently to similar treatment? Many studies have suggested that measuring the patient's psychometric qualities or tracking their "yellow flags" will help determine which patients are likely to succeed or fail, regardless of the type of care rendered. These questions include tracking issues such as coping strategies; anxiety and depression; the patient's perception of work tolerance; whether they think they will be able to work in the future; and patient satisfaction. A patient-driven questionnaire has also been created to capture this information (Liebenson, Yeomans. In: Yeomans (ed., 2000).
So far, only subjective patient-driven tools have been described. Many physical examination tools that have been found to be valid, reliable and responsive to change over time help support functional improvements reported in the subjective tools. These tests also offer prescriptive information; an abnormal test such as a repetitive sit-up test that yields a patient score of 56% can be re-evaluated after a rehabilitation service has been offered, proving the program's necessity. These tests are also discussed at length (Yeomans, 2000).
Conclusion
The balance between optimum and adequate becomes obvious after examining the goals of these different tools. The method in which these tools are implemented into the clinical setting is also critical to the success of becoming outcomes and literature based. For example, software is available in which scores from the previously mentioned questionnaires (and others) are computed and graphically reported, making it easy to compare scores between examinations. Diagnostic triage differentiating between red flags, nerve root conditions and mechanical spinal conditions is also programmed into the software. Making this process easy is important if an outcomes-based management approach is to be swiftly and painlessly implemented into your practice.
If you haven't yet felt the "heat" from insurers or managed care groups, you will. Your ability to communicate effectively will directly affect your market share in today's demanding health care industry.
References
- Bolton JE, Wilkinson RC. Responsiveness of pain scales: a comparison of three pain intensity measures in chiropractic patients. J Manipulative Physiol Ther 1998;21:1-7.
- Fairbank J, Davies J, et al. The Oswestry Low Back Pain Disability Questionnaire. Physiother 1980;66(18):271-273.
- Cherkin DC, Deyo RA, Street JH, Barlow W. Predicting poor outcomes for back pain seen in primary care using patients' own criteria. Spine 1996;21:2900-2907.
- Deyo RA, Diehl AK. Cancer as a cause of back pain: frequency, clinical presentation and diagnostic strategies. J Gen Intern Med 1988;3:230-238.
- Deyo RA. Early detection of cancer, infection, and inflammatory disease of the spine. J Back Musculoskeletal Rehabil 1991;1:69-81.
- Deyo RA, Rainville J, et al. What can the history and physical examination tell us about low back pain? JAMA Aug. 12, 1992;268(6):760-5.
- Frank JW, Kerr MS, Brooker AS, DeMaio SE, Maetzel A, et al. Disability resulting from occupational low back pain. Part II: What do we know about secondary prevention? Spine 1996;21:2918-2929.
- Hazard RG, Haugh LD, Reid S, Preble JB, MacDonald L. Early prediction of chronic disability after occupational low back injury. Spine 1996;21:945-951.
- Linton SJ, Hallden BH. Can we screen for problematic back pain? A screening questionnaire for predicting outcome in acute and subacute back pain. Clin J Pain 1998:14;1-7.
- Ohlund C, Eek C, Palmblad S, Areskoug B, Nachemson A. Quantified pain drawing in subacute low back pain: validation in a non-selected outpatient industrial sample. Spine 1996;21:1021-1031.
- Parker H, Wood PLR, Main CJ. The uses of the pain drawing as a screening measure to predict psychological distress in chronic low back pain. Spine 1995;20:236-243.
- Roland M, Morris R. A study of the natural history of back pain. Part I: development of a reliable and sensitive measure of disability in low-back pain. Spine 1983a;8:141-144.
- Roland M, Morris R. A study of the natural history of low back pain, part II. Spine 1983b;8(2):145-150.
- Vernon H, Mior S. The neck disability index: a study of reliability and validity. J Manipulative Physiol Ther 1991;14:409-415.
- von Korff M, Ormel J, Keefe F, Dworkin SF. Grading the severity of chronic pain. Pain 1992;50:133-149.
- von Korff M, Deyo RA, Cherkin D, Barlow W. Back pain in primary care: outcomes at one year. Spine 1993;18:855-62.
- Ware Jr. JE, Kosinski M, Keller SD. SF-12: How to Score the SF-12 Physical. The Mental Health Summary Scales, second edition. Boston: The Health Institute, New England Medical Center, March 1995.
- Ware Jr. JE, Kosinski M, Keller SD. SF-36 Physical & Mental Health Summary Scales: A User's Manual. Boston: The Health Institute, New England Medical Center, December 1994.
- Yeomans SG. (ed.) Clinical Application of Outcomes Assessment. Stamford, CT: Appleton & Lange, 2000. ISBN # 0-8385-1528-2; (800) 262-4729.


