It’s a new year and many chiropractors are evaluating what will enhance their respective practices, particularly as it relates to their bottom line. One of the most common questions I get is: “Do I need to be credentialed to bill insurance, and what are the best plans to join?” It’s a loaded question – but one every DC ponders. Whether you're already in-network or pondering whether to join, here's what you need to know.
Practical Auto Crash Reconstruction in LOSRIC, Part V
Application of the Technique
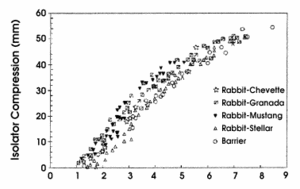
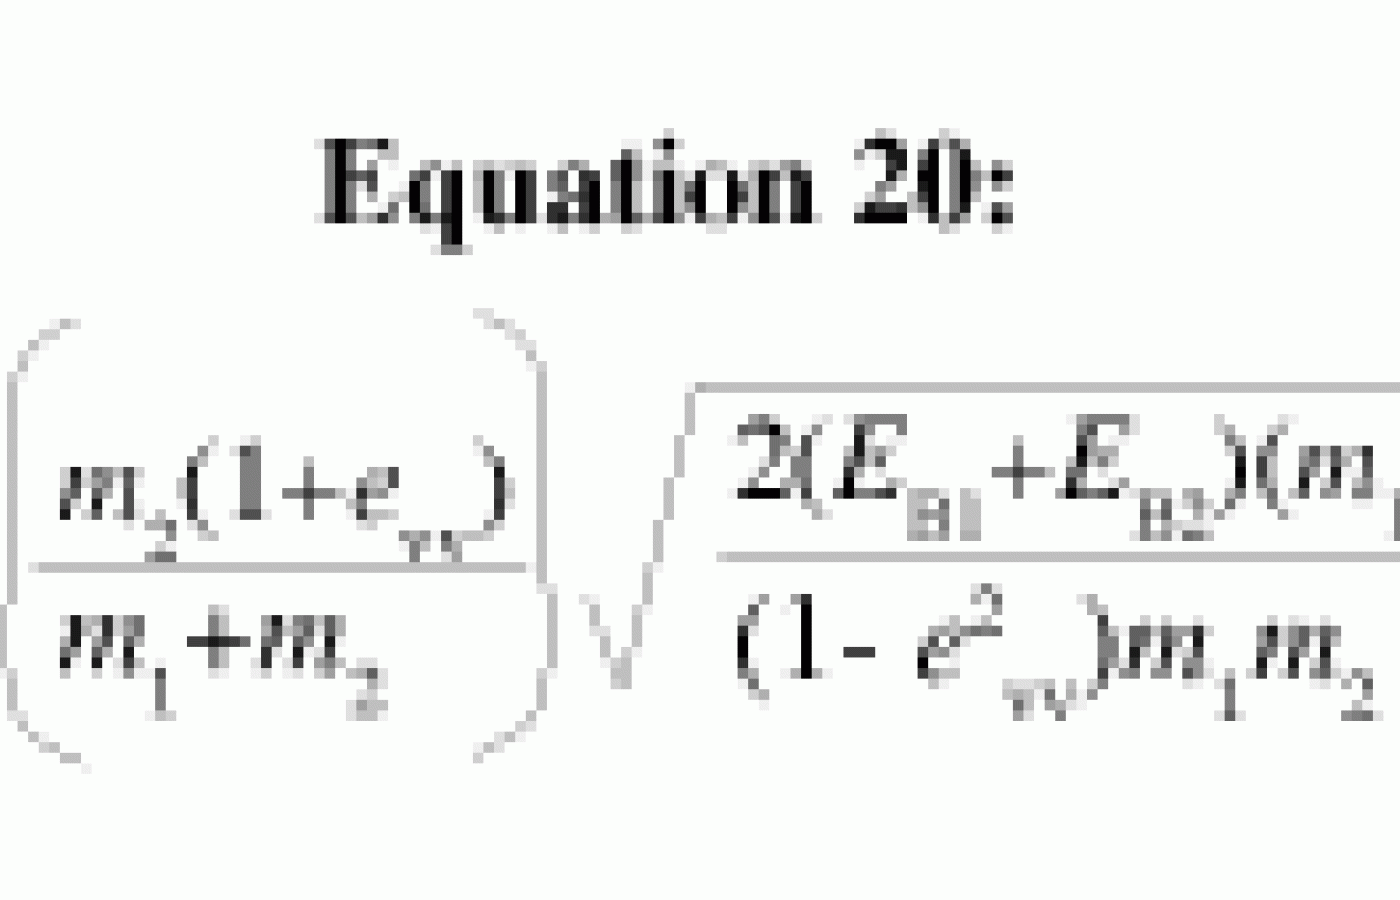
Suppose that you measured 22mm of isolator compression from the "bullet" car. (The bullet car, symbolized as V1, is a car that strikes a stopped car. The stopped car is referred to as the "target" car, or V2.) The bullet car is the approximate size of a VW Rabbit. The graph tells us that 22mm of isolator compression would correspond to about 0.35 kJ, or about 350 joules (J) of energy. Suppose also that from the target car (V2), you measured 40mm of compression. This would correspond to about 850 J of energy and a value for e of about 0.6. Finally, checking on the weights of the two cars, you discover that the target car (V1) weighs 2,040 lbs (927 kg) and V2 weighs 1,870 lbs (850 kg). From equation 20, we calculate as follows:


We can convert 2.2ms-1 to 4.9 mph. Now that we have the speed change of V1, we can calculate the speed change of V2 using equation 21 as follows:


This converts to 5.4 mph (or to 7.9 fps). Now that we know the speed change for the target car (V2), using equation 30, we can calculate the closing speed of the collision:


So the closing speed was 9.5 fps, or about 6.4 mph, setting the speed change of the target car (V2) at about 80% of that figure, which is typical of LOSRIC in this range. Structural damage would be unlikely in either vehicle, outside of minor cosmetic damage.
Based on most of the crash test research reported to date,2,13,16-18 the threshold for injury has hitherto been suggested to be a speed change of about 5 mph. In Brault et al.,6 we find more recent and better designed research which has subsequently offered convincing evidence that this figure (5 mph) should be brought down to 2.5 mph. Moreover, as my colleagues and I pointed out recently,19 these "thresholds" that result from human volunteer crash testing are neither scientifically validated nor reliable.
The majority of these studies -- while appropriately conducted from an engineering standpoint and providing very important information -- were not designed to answer questions of injury threshold. However, because their authors did wager to speculate on the question, the foray has earned them some criticism regarding the following methodological weakness: 1. nonrepresentative crash conditions; 2. inadequate sample size; 3. nonrepresentative study sample.
Even the Brault et al.6 paper -- which I consider the best of its kind to date -- presents some problems when we attempt to extrapolate to the universe of exposed occupants:
- Persons they considered to be at risk of injury were screened out using MRI;
- Occupants were fully aware of the impending crash and were seated in near optimal positions, although attempts were made to relax them and to mask the exact moment of the crash;
- No children participated;
- The possibility of self-selection exists -- are those who answer a newspaper ad recruiting crash test volunteers generally heartier than most people? Are they less likely to have ever had neck pain? In this type of research, these questions will always arise, because it is virtually impossible to design a study which eliminates them entirely.
It's easy to be swept away in the magic of mathematics, its beauty and precision often times clouding our objective analysis of the real world. Yes, we did obtain the measurement of e and kJ with due care from the graphs, the vehicle weights were correct, and we checked our calculations twice. But did we accurately measure the isolator stroking? Were all of the score marks really visible to us? Was one of the isolators actually frozen and nonfunctional -- a rare but possible condition which can only be verified by disassembling and testing them? And what about the comparability issue: the cars in our example were not Rabbits (from which this data was derived). What if the isolators on these cars behave differently? Clearly, it would be wiser to allow for a degree of uncertainty (ok sign). In fact, this is precisely what the better schools of ACR recommend. What results is not a single figure, but a range of figures within which the true value most likely resides.
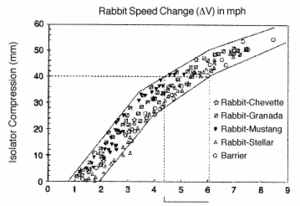
This is often referred to as a sensitivity analysis. How can we do that using the isolator data? Looking back at Figure 8, we can easily draw corridors enclosing the data points (also see Figure 12). This method was proposed by Szabo et al.14
Figure 8:


Figure 12: The combined data from several repeated vehicle-to-vehicle and vehicle-to-barrier crash tests, adapted from Siegmund et al.3 Corridors enclose nearly all data points (some of which are omitted for clarity). To measure speed range, average the two isolator measurements taken from the vehicle. Take the lower speed from the point at which a horizontal line intersects the left corridor boundary line. The upper speed range is taken from the point at which this horizontal line intersects the right corridor boundary line. Remember that these figures should be used cautiously in crashes involving vehicles of greater differing masses. Reprinted with permission from Whiplash: The Masters' Certification Program, Module 2.
From the previous example, using the known masses of both vehicles and the isolator travel of both vehicles, we calculated a speed change of 5.4 mph for the target car (V2). Using the method described above, we could simply have consulted the isolator compression vs. speed change graph and measured a range of 4.4 mph to 6.0 mph, which does contain the more rigorously obtained 5.4 mph value. Certainly, this is accurate enough for our needs. Bear in mind, however, that this figure represents the delta V of the vehicle only. Owing to other factors such as seat bounce, resulting from the elastic nature of most seat backs, the occupant's delta V may be higher than the vehicle's. This can result in head and torso overspeed conditions in which these parts move faster than the rest of the system.
After the Reconstruction ...
As we've seen, it can be a reasonably easy thing to estimate delta V from isolator travel. Without that, and faced with a car with no significant damage, one can only conclude (from that evidence) that the speed change would have been somewhere above 1 mph and below the speed change at which we find the damage threshold of the vehicle. The damage thresholds for most passenger vehicles is a closing speed of about 8-12 mph (reference 4, p. 36). In crashes between like sized passenger cares at low speed ranges,the delta V will be approximately 70-80% of the closing speed. Kornhauser's8 paper suggests even higher speeds are possible under the right circumstances. Szabo et al.14 reported, for example, that the Honda Accord foam bumper is particularly stiff, and impact speeds of up to 17 mph are possible without permanent damage.
From a purely practical standpoint, for a physician who is called upon to render testimony as to the plausibility of injury resulting from a particular crash, especially in cases where the doctor is neither an engineer nor an ACR, if there is significant crush damage to either vehicle in in-line rear-impact crashes, it is sufficient for the doctor to conclude that the threshold for injury has been breached for at least some persons. This is clearly the only available logical conclusion, since nearly all reported injuries in staged crash tests, using volunteers in relatively good health and afflicted with few or none of the known risk factors for injury, have occurred in delta Vs at or below 5 mph (see reference 4, p. 97-99 for a comprehensive treatment of the subject of risk factor analysis in LOSRIC). And in almost none of these crash tests did the test vehicles sustain significant structural damage. (In certain circumstances, such as when bumper override/underride occurs, softer portions of the car meet the bumper, resulting in a longer duration crash. This effectively reduces the acceleration loads on the occupant, despite the increase in property damage.)
From there, the physician should move on to more practical and less esoteric or theoretical matters. The physican should determine from the history and physical examination of the patient whether an injury occurred. Thus, consider a triangle of the relative weight and merit of evidence in a LOSRIC case where the top portion represents the highest weight (a weight of 4) and is attached to a comprehensive history and examination of the patient by an experienced physician. The right corner represents a thorough understanding of relevant clinical literature (a weight of 2). The lowers weight is attached to simple crash reconstructions and citation to engineering literature and selected other literature (a weight of 1). Thus, even in cases where the base of the triangle is covered (1+2), the expert's testimony has less weight than the physician's. Thus, the greatest weight would be assigned to the examination (and care and followup) of the patient.
If the physician is careful to ask the appropriate questions regarding those factors that have been shown scientifically to significantly affect the risk of injury and outcome and compares the patient with previous experience, he/she will be in the best position to render a qualified opinion as to causation -- even in the absence of any information about crash parameters. Of course, such information, along with acquaintance with the relevant clinical literature, would further strengthen the physician's opinion. The corner of the triangle with the least weight is the engineering literature and calculations of crash parameters. The reason for its lowly position is simply that it is an imprecise science at best, and because there is virtually not a shred of scientific evidence that engineers, biomechanists or ACRs can actually predict injuries or outcome simply from knowing crash parameters. In fact, the evidence is that it cannot be done.20-23
Most ACRs have not studied or practiced any healing art which gives them any direct experience with patients; they rarely even have occasion to talk to patients. If they are aware of the clinical risk factors, it is rarely apparent in their reports since they rarely make any allowances for variances in gender, body mass, age, prior injury, out-of-position-occupant, etc. Many rely instead on police reports photographs and deposition transcripts. Thus, the relative merit or weight of evidence from those possessing both a knowledge of clinical literature and engineering principles and performing a reconstruction (i.e., 1+2=3) still falls below that of the experienced comprehensive clinical examination of the actual patient. To believe otherwise is a logical absurdity.
Unfortunately, it doesn't always work out this way in the court room, but that's beginning to change.
References
- Fricke LB. Traffic Accident Reconstruction. Volume 2 of the Traffic Accident Investigation Manual. Evanston: Northwestern University Traffic Institute, 1990, p. 68-127.
- Szabo TJ, Welcher JB, Anderson RD, et al. Human occupant kinematic response to low speed rear end impacts. SAE Tech Paper Series 940532, 1994, p. 23-35.
- Siegmund GP, King DJ, Montgomery DT. Using barrier impact data to determine speed change in aligned, low speed vehicle-to-vehicle collisions. SAE Technical Paper Series 960887, 1996, p. 147-167.
- Croft AC. Whiplash: The Masters' Certification Program, Module 1. Whiplash: Advanced Topics. San Diego: Spine Research Institute of San Diego, 1999.
- Siegmund GP, Bailey MN, King DJ. Characteristics of specific automobile bumpers in low velocity impacts. SAE Technical Paper Series 940916, 1994, p. 333-371.
- Brault JR, Wheeler JB, Siegmund GP, Brault EJ. Clinical response of human subjects to rear-end automobile collisions. Archives of Physical Medicine & Rehabilitation 1998;79:72-80.
- Siegmund GP, King DJ, Lawrence JM, Wheeler JB, Brault JR, Smith TA. Head/neck kinematic response of human subjects in low-speed rear-end collisions. SAE Technical Paper 973341, 1997, p. 357-385.
- Kornhauser M. Delta v thresholds for cervical spine injury. SAE Technical Paper Series 960093, 1996, p. 1-13.
- Ward C, Hoffman M. Mechanisms of injury and associated forces in high speed rear end impacts. High speed rear impact TOPTEC, Tempe, AZ, Oct. 27-28, 1997.
- Campbell KL. Energy basis for collision severity. SAE Technical Paper 740565; SAE, 1974.
- McHenry RR. A comparison of results obtained with different analytical techniques for reconstruction of highway accidents. SAE Technical Paper 750893; SAE, 1975.
- King DJ, Siegmund GP, Bailey MN. Automobile bumper behavior in low-speed impacts. SAE Tech Paper Series 930211, 1993, p. 1-18.
- Szabo TJ, Welcher JB. Human subject kinematics and electromyographic activity during low speed rear impacts. SAE Paper 962432, 1996, p. 339-356.
- Szabo TJ, Welcher JB, Haight WR. Analysis of Low Speed Collisions. Texas A&M University; Texas Engineering Extension Service, 1998, 2:2.
- Anderson RD, Welcher JB, Szabo TJ, Eubanks JJ, Haight WR. Effect of braking on human occupant and vehicle kinematics in low speed rear end collisions. SAE Technical Paper 980298; SAE, 1998, p. 1-13.
- West DH, Gough JP, Harper TK. Low speed collision testing using human subjects. Accid Reconstr J 1993;5(3):22-26.
- McConnell WE, Howard RP, Poppel JV, et al. Human head and neck kinematic after low velocity rear-end impacts: understanding "whiplash." 39th Stapp Car Crash Conference Proceedings 952724; 1995, p. 215-238.
- McConnell WE, Howard RP, Guzman HM, et al. Analysis of human test subject kinematic responses to low velocity rear end impacts. SAE Tech Paper Series 930889; 1993, p. 21-31.
- Freeman MD, Croft AC, Rossignol AM, Weaver DR, Reiser M. A review and methodologic critique of the literature refuting whiplash syndrome. Spine 1999;24(1):86-98.
- Severy DM, Mathewson JH, Bechtol CO. Controlled automobile rear-end collisions, an investigation of related engineering and mechanical phenomenon. Can Services Med J 1955;11:727-758.
- Larder DR, Twiss MK, Mackay GM. Neck injury to car occupants using seat belts. 29th Ann Proc Am Assoc Auto Med 1985;153-165.
- Macnab I. Acceleration extension injuries of the cervical spine. In: Rothman RH, Simeone FA (eds.) The Spine, vol. 2. Philadelphia: W.B. Saunders, 1982, p. 647-660.
- Radanov BP, Sturzenegger M, Stefano GD. Long-term outcome after whiplash injury: a two-year followup considering features of injury mechanism and somatic, radiologic and psychosocial factors. Medicine 1995;74(5):281-297.


